[Market Microstructure]
Trying to Make Your Next Investment? A Pricing Check on Banking, Insurance, and Hydropower sector
Date: July 4, 2026
Reading Time: 12 minutes
Author: ArthaVega Research Team
Cheap or Trap? Relative Valuation Across Nepal's Banking, Insurance & Hydropower Stocks
"It's cheap for a reason — or it's just cheap." The numbers decide which.
Everybody wants to earn a fortune through the stock market. Only a few percent succeed. Every investor has their own way of picking stocks and forming opinions on whether a stock is cheap or expensive. In this article, we look at the relative valuation of three different sectors, where we've picked similar stocks and used the P/E ratio, P/B ratio, EV/EBITDA, and Graham Value to check whether a stock is over or undervalued.
What is relative valuation?
Relative valuation is the practice of judging whether a stock is cheap or expensive by comparing it to similar companies, rather than calculating its value from scratch.
For example:
Imagine a football club is trying to sign a young striker in the summer transfer window. Rather than calculating exactly how many goals, trophies, shirt sales, and prize money the player will generate over the next five years, the club first looks at the transfer market. If other strikers of a similar age, position, ability, and performance have recently been sold for around €80–90 million, the club assumes this player should be valued in the same range. Even if they believe he is slightly better or worse, they use those recent transfers as a benchmark to negotiate a fair price. This is relative valuation.
In finance, investors do the same thing with companies. Instead of estimating a company's value from scratch, they compare it with similar companies in the same industry using measures such as the Price-to-Earnings (P/E) or EV/EBITDA ratio. Just as a football club compares a player's transfer fee with similar players, investors compare a company's valuation with that of comparable firms to decide whether it is fairly priced, undervalued, or overvalued.
Brief history of relative valuation
Relative valuation began when investors started looking beyond a stock's price alone and started comparing it to a company's earnings and assets. Benjamin Graham, often called the father of value investing, formalized much of this thinking in his 1934 book Security Analysis, co-authored with David Dodd. Graham argued that a stock's price should be judged against measurable fundamentals like earnings, dividends, and book value. He later introduced his intrinsic value formula as a simple way to estimate what a stock was really worth.
The P/E ratio became a mainstream tool through the mid-20th century as financial reporting standardized and earnings data became widely available, making it easy to compare companies within the same industry. The P/B ratio gained particular importance in sectors like banking and insurance, where book value closely reflects a company's real economic worth. EV/EBITDA emerged later, gaining popularity from the 1980s onward alongside the rise of leveraged buyouts (LBOs), as analysts needed a metric that accounted for differences in debt levels between companies — something P/E ratios ignore entirely.
Today, relative valuation remains one of the most widely used approaches in equity analysis, precisely because it doesn't require forecasting future cash flows the way discounted cash flow (DCF) models do.
Key terminologies used in this article
P/E ratio (Price to Earnings ratio):
Measures how much investors are paying for each rupee of a company's annual earnings.
P/E = Market Price per Share / Earnings per Share (EPS)
Earnings per Share (EPS):
Measures how much profit a company generates for each outstanding share.
EPS = Net Profit / Total Number of Outstanding Shares
P/B ratio (Price to Book value ratio):
Compares the market price of a stock to its book value per share.
P/B = Market Price per Share ÷ Book Value per Share
Book value per share:
Measures the net asset value of a company attributable to each outstanding share.
Book Value per Share = (Total Assets − Total Liabilities) ÷ Total Number of Outstanding Shares
Graham Value: A formula developed by Benjamin Graham to estimate a stock's intrinsic value based on its earnings and book value:
Graham Value = √(22.5 × EPS × BVPS)
Comparing this intrinsic value to the market price shows whether a stock is over or undervalued.
EBITDA (Earnings Before Interest, Taxes, Depreciation, and Amortization):
A measure of a company's core operating profit, before accounting for financing costs, tax obligations, and non-cash accounting charges like depreciation and amortization.
EBITDA = Net Profit + Interest + Taxes + Depreciation + Amortization
Enterprise Value (EV):
The total value of a company, representing what it would theoretically cost to acquire the entire business, including not just its equity but its debt too, net of cash on hand.
EV = Market Capitalization + Total Debt − Cash and Cash Equivalents
For this article
We selected comparable peers using a scale metric appropriate to each sector, not just companies in the same industry:
- Commercial Banks: Total Deposits between Rs. 300–350 billion
- Hydropower: Installed Capacity between 22–24 MW
- Life Insurance: Big 4 insurers, covering more than two-thirds of market share
Banking Sector
Price-to-Earnings (P/E)
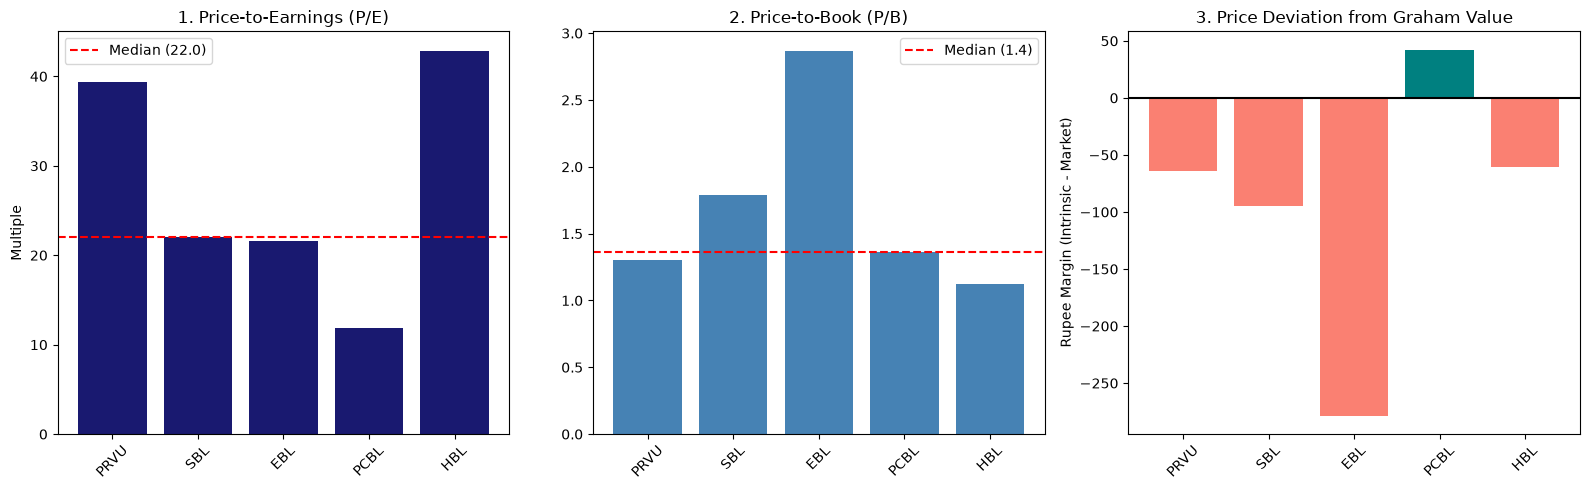
We can think of the P/E ratio as the price tag the market puts on a bank's current earnings. Right now, the sector standard sits at a median of 22.0x, meaning investors typically pay 22 rupees for every 1 rupee of profit the bank generates. The banks HBL (~43x) and PRVU (~39x) are trading at roughly double the sector average. This signals that the market is either highly optimistic about their future growth or is simply willing to pay a heavy premium for them.
On the other hand, average performers like SBL (~22x) and EBL (~21.5x) sit right on the baseline, representing a completely standard, textbook price for the sector. The ultimate bargain is PCBL (~12x), which stands as a clear outlier by trading at nearly half the sector average, meaning the market is pricing its earnings at a massive discount and instantly flagging it as structurally cheap on this metric alone.
Price-to-Book (P/B)
Because a commercial bank's value is deeply tied to its liquid assets and loan portfolio, a sector median of 1.4x indicates that the market usually buys these net assets at a slight premium — but analyzing this asset layer completely flips the valuation landscape upside down. EBL (~2.85x) commands the highest premium in the sector, trading at more than double the median; even though its P/E ratio looked completely average, investors are aggressively bidding up its actual balance sheet, paying heavily for its underlying asset quality, return profile, or high safety margins.
SBL (~1.8x) also trades at an asset premium, whereas PRVU, PCBL, and HBL all sit at a discount below the median, between roughly 1.1x and 1.35x. This creates a clear valuation disconnect for HBL and PRVU, where the market is paying a massive premium for their earnings (high P/E) but refuses to pay a premium for their actual book equity (low P/B).
The Graham Value
The Graham Value deviation chart acts as a filter by combining both earnings and assets to calculate a stock's maximum conservative fair value, giving a clear visual of which market prices have outrun their fundamental backing. In this framework, any red bar indicates a market price that has outgrown its safety ceiling, and four out of the five banks fail this strict test by trading on the overvalued side.
EBL breaks the ceiling by the widest margin, plunging past ~Rs 280 overvalued because its inflated 2.85x P/B ratio skews the calculation and pulls it far outside conservative asset limits. It is followed past its safety ceiling by SBL (~Rs 95), PRVU (~Rs 62), and HBL (~Rs 58). PCBL stands completely alone as a mathematically viable value play, showing a positive real margin of about Rs 42 undervalued. Since it successfully paired a cheap P/E with a very reasonable P/B, it is the only name in the entire sector that screens as fundamentally undervalued across all three metrics simultaneously.
Our calculation is that PCBL is the only undervalued stock among this group.
Insurance Sector
Price-to-Earnings (P/E)
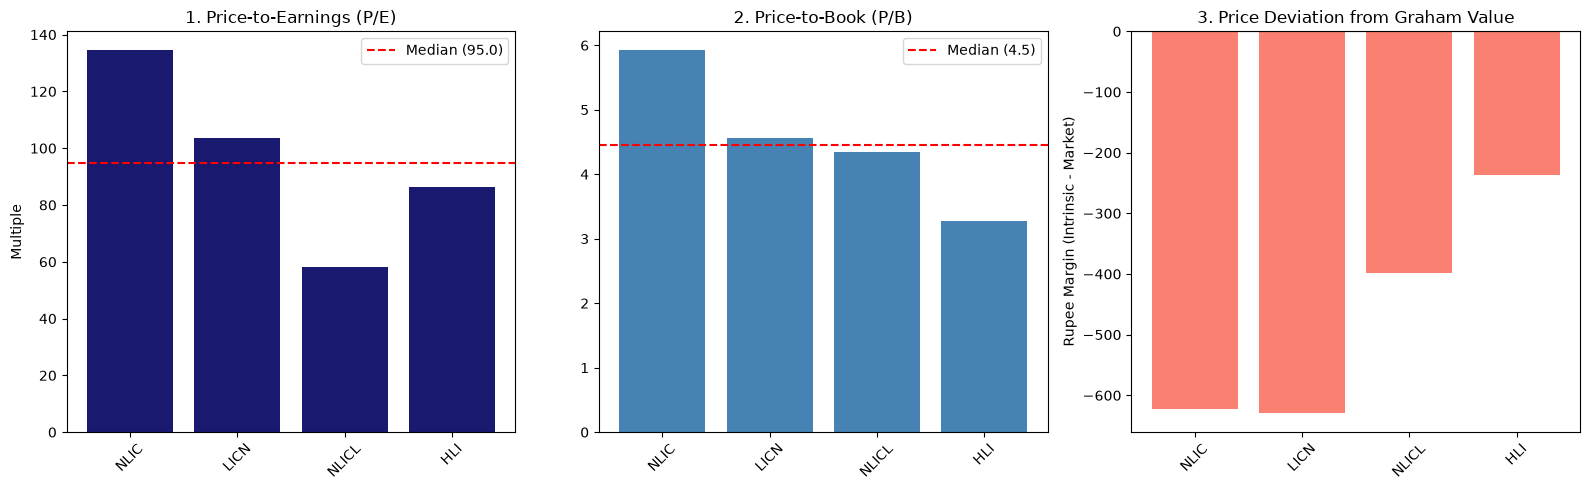
In this figure, the sector baseline sits at an exceptionally high median P/E of 95.0x, showing that the market demands a steep premium for insurance earnings. NLIC (~135x) trades at an extreme premium well above this baseline, indicating that the market is either pricing in massive growth expectations or heavily overvaluing its current earnings stream. LICN (~103x) also sits comfortably above the median, reflecting strong market pricing.
Conversely, HLI (~86x) trades at a minor discount to the baseline, while NLICL (~58x) is the sharpest operational outlier on this chart, trading at nearly half the sector median and flagging the stock as structurally cheap relative to its peers on this metric alone.
Price-to-Book (P/B)
Analyzing the asset layer against the sector median of 4.5x shows a relatively consistent valuation alignment across the board, though significant gaps still exist. NLIC (~5.9x) completely dominates this metric, trading far above the sector average and proving that investors are aggressively bidding up its actual balance sheet equity.
LICN (~4.6x) runs right along the sector norm, while NLICL (~4.35x) and HLI (~3.3x) both sit at a discount below the median, with HLI offering the deepest discount on net assets despite its earnings being priced reasonably close to the sector average.
The Graham Value Deviation
Here, LICN and NLIC break the ceiling by the widest margins, plunging past ~Rs 630 and ~Rs 620 overvalued respectively. Both names are heavily penalized by their inflated P/E and P/B multiples, which pull them far outside conservative fundamental boundaries. They are followed past their safety ceilings by NLICL (~Rs 400) and HLI (~Rs 235).
Unlike the banking sector, the insurance sector offers absolutely no value plays here since every single name has run up too high past its fundamentals to provide any margin of safety for a strict value investor.
Our say: none of the stocks here are undervalued.
Hydropower Sector
Operational Strength (Annual EBITDA)
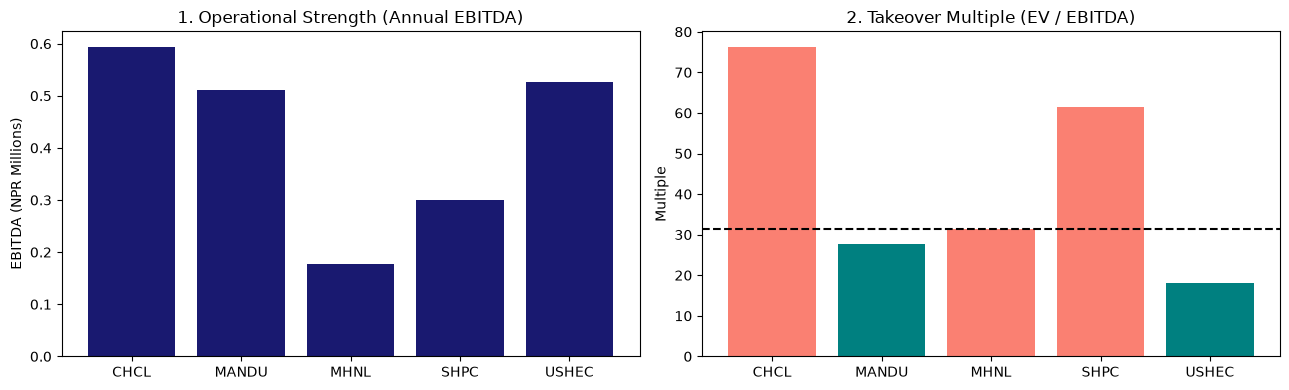
The first chart measures raw core operating profitability before interest, taxes, depreciation, and amortization, denominated in millions of NPR. CHCL (~0.59M), USHEC (~0.52M), and MANDU (~0.51M) form the dominant upper tier of the peer group. SHPC (~0.30M) occupies the mid-tier, while MHNL (~0.18M) shows the weakest operational capacity on the chart, generating less than a third of the cash flow produced by the sector leader.
EV / EBITDA
Unlike the other two sectors, here we used EV/EBITDA because it strips out massive non-cash depreciation and varying debt structures to measure the true operational cash payback period of the asset. The second chart contrasts total enterprise value against operating cash flow to show what multiple of core earnings the market demands, utilizing a sector baseline dashed line at roughly 31x.
This metric reveals a massive disconnect between absolute cash flow and relative valuation, dividing the peer group into highly distinct segments. On one side, CHCL (~76x) and SHPC (~61x) trade deep in overvalued territory (represented by the coral bars) far above the baseline; while CHCL's high price aligns with its leading operational strength, SHPC commands an extremely expensive premium despite having mediocre, mid-tier cash generation.
MHNL (~31x) sits directly on the sector baseline, indicating standard market pricing relative to its small operating footprint. Conversely, MANDU (~27x) and USHEC (~18x) stand out as the clear undervalued bargains (represented by the teal bars), trading well below the baseline — with USHEC acting as the most compelling play on the entire dashboard by delivering the second-highest absolute operating profit while being priced at the cheapest multiple in the sector.
Our say: MANDU and USHEC are undervalued hydropower stocks in the range we have chosen.
Conclusion and Summary of Findings
Based on the relative valuation analysis, incorporating P/E, P/B, and Graham Value metrics for banking and insurance, and EV/EBITDA for hydropower, the market displays varying levels of efficiency and premium pricing across sectors. The following table summarizes the identified opportunities:
| Sector | Identified Undervalued Stocks | Primary Basis for Conclusion |
|---|---|---|
| Banking | PCBL | Only stock to screen as fundamentally undervalued across P/E, P/B, and Graham Value. |
| Insurance | None | All analyzed stocks exceed their conservative Graham Value safety ceilings. |
| Hydropower | MANDU, USHEC | Trade significantly below the sector median EV/EBITDA baseline of 31x. |
Key Takeaways
- The Power of Filtering: By applying multiple metrics (earnings, assets, and cash flow), we can strip away market sentiment to identify genuine discrepancies between price and value.
- Sector Realities: The banking sector shows a clear "value" outlier in PCBL. In contrast, the insurance sector is currently characterized by high market premiums, leaving little margin of safety for strict value investors. The hydropower sector reveals that high absolute profitability does not always equate to a high stock price, as seen in the favorable EV/EBITDA positioning of USHEC.
Important Reminder for Investors (Disclaimer)
Relative valuation is a powerful screening tool, but it is not a crystal ball. Please keep the following in mind when using these insights:
- Benchmarks are not Guarantees: A stock trading at a discount compared to its peers is cheap on a relative basis, but it does not automatically mean it will rise in price. It may be undervalued for valid reasons, such as poor management, legal risks, or declining industry prospects (a "value trap").
- Context Matters: Metrics like P/E and EV/EBITDA do not account for qualitative factors. Always investigate why a company is trading at a discount. Does it have high debt, pending litigation, or stagnant growth?
- Dynamic Market: Valuation is a snapshot in time. A stock that appears undervalued today can quickly become overvalued if its fundamentals (earnings or assets) deteriorate or if market sentiment shifts rapidly.
- Use as a Starting Point: Use this analysis as a starting point for your research, not the final word. Always conduct your own due diligence or consult with a qualified financial advisor before making any investment decisions.