[Risk Management]
The Martingale Paradox: Why “Quitters Never Win” Fails in NEPSE
Date: April 11, 2026
Reading Time: 12 minutes
Author: ArthaVega Research Team
The Martingale Trap: Testing a Gambling Strategy on Nepal's Stock Market
"Quitters never win." You've probably seen this line while scrolling through reels or social media. It sounds inspiring at first, but in many cases, especially in gambling, it is linked to a risky approach called the Martingale Strategy.
Introduction
What happens when a classic gambling strategy meets one of Asia's most volatile equity markets? That's exactly what we set out to explore.
We worked with five years of real NEPSE (Nepal Stock Exchange) data, ran it through Python, and tested the Martingale strategy in a fairly detailed way. This included factoring in transaction fees, running Monte Carlo simulations, and pushing the system through different stress scenarios. The results were hard to ignore.
In this report, we break down what we observed, where the strategy starts to fall apart, and what the numbers actually say about the limits of doubling down in a market that does not behave in a predictable or balanced way.
What Is the Martingale Strategy?
Every time you lose a bet, you double the amount on the next one. The idea is that when you finally win, you recover all your previous losses and still make a small profit equal to your initial bet. However, doing this requires a large amount of money, practically infinite, and assumes that the probability of winning is 0.5 or 50 percent each time where there can be two possible outcomes.
Applying Martingale to NEPSE
We tried to apply this strategy in one of the most volatile equity markets — NEPSE — where we assume:
- Green candle = Win
- Red or unchanged candle = Loss
We took five years of NEPSE data and fed it into Python to analyze and visualize the trends. What we found was quite interesting. Over this period, NEPSE showed more losing sessions than winning ones, meaning the number of red or unchanged candles was higher than green candles.
Here, we are trying to apply the Martingale betting strategy in NEPSE to see if it can generate consistent returns. However, since the probability of losses is higher than wins, the strategy faces a major challenge. The Martingale approach relies on a fairly balanced probability, but in this case, the odds are already tilted toward losses.
As a result, instead of recovering losses, the strategy is more likely to amplify them. In simple terms, when losses are greater than wins, the Martingale strategy tends to suffer rather than succeed.
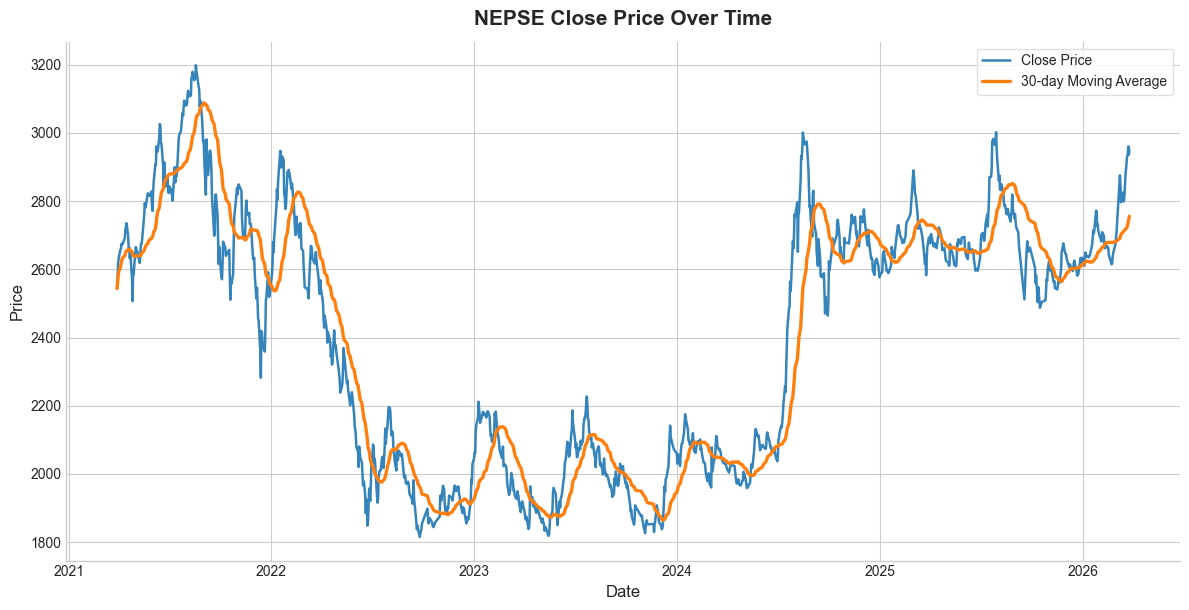 Figure 1: NEPSE Close Price Over Time with 30-day Moving Average (2021–2026)
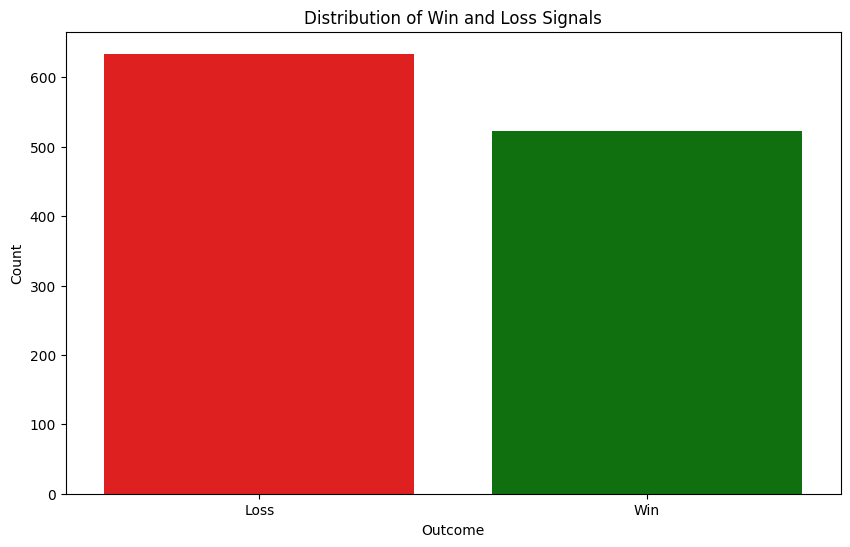 Figure 2: Distribution of Win and Loss Signals — Loss count visibly exceeds Win count
Backtest on NEPSE
Base Capital: NPR 100,000 | Base Bet Size: NPR 1,000
Note: We cannot directly trade the NEPSE index in the current market.
Parameters
| Setting | Value |
|---|---|
| Starting Capital | NPR 100,000 |
| Base Bet Size | NPR 1,000 |
| Maximum Bet Cap | NPR 5,000 |
| Transaction Fee | 0.40% (realistic NEPSE brokerage) |
Results
| Scenario | Final Balance | PnL | ROI | Max Drawdown | Ruin Reached? |
|---|---|---|---|---|---|
| No Fee | NPR 108,000.00 | NPR 8,000 | 8.00% | 6.09% | True |
| With Fee (0.40%) | NPR 107,872.00 | NPR 7,872 | 7.87% | 6.12% | True |
- PnL = Profit and Loss
- ROI = Return on Investment
- Max Drawdown = Maximum observed loss from a historical peak to a subsequent trough of the equity curve
- Ruin Reached = Point of strategy exhaustion — occurs when the sequence of losses requires a bet size exceeding the Max Bet limit (NPR 5,000) or the available capital
We did a Martingale backtest and plotted the equity curve with peak, drawdown, and fee effects. Normally the Martingale strategy gets the total amount in return and recovers the loss after a win. However, with fees introduced at 0.4%, it cannot recover the whole amount. Hence, recovery becomes incomplete.
 Figure 3: Martingale on NEPSE — Equity Curve with Fee (0.40%), max_bet = 5000. Peak: 114,900
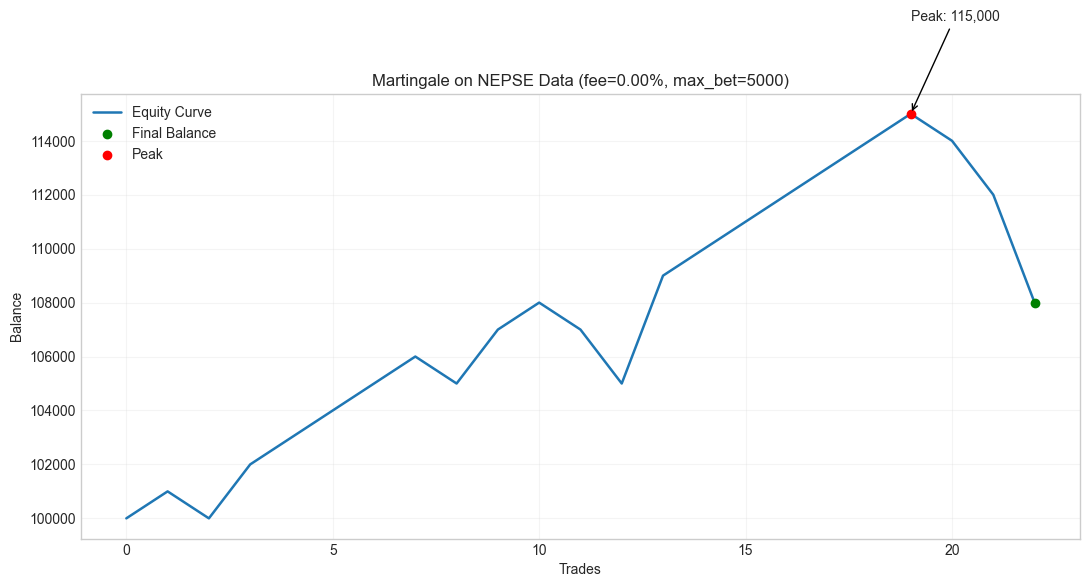 Figure 4: Martingale on NEPSE — Equity Curve without Fee (0.00%), max_bet = 5000. Peak: 115,000
The Losing Streak Problem: Why 21 Days Is Dangerous
Candle Trend in NEPSE
Over the last five years, the maximum Losing Streak (Red Candle) is 21.
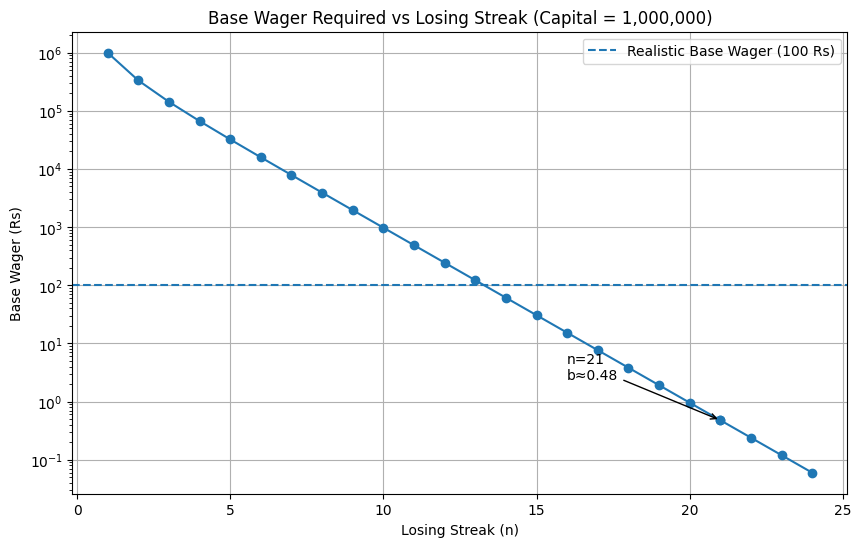 Figure 5: Base Wager Required vs Losing Streak (Capital = 1,000,000). At n=21, b ≈ 0.48
This plot shows the survival limit of the strategy. As the losing streak increases along the X-axis, the capital available to support the base wager drops very rapidly. The decline is not linear and accelerates with each additional loss.
What this really highlights is that a long losing streak reduces your capital. It pushes the system to a point where continuing the strategy is no longer possible.
The Win Probability (NEPSE) is 0.4520. Since the probability of a winning day is less than 50% (0.45), the market has a natural negative bias for this strategy. Statistically, this makes long losing streaks inevitable over time.
The analysis of NEPSE data shows a maximum losing streak of 21 consecutive days, which is extremely dangerous for a Martingale strategy. Since Martingale requires doubling the wager after every loss, the required capital grows exponentially and quickly becomes unsustainable.
The Math Behind the Collapse
Using the relation:
C = b × (2ⁿ − 1)
Where:
C = 100,000   (initial capital)
n = 21        (losing streak)
→ b ≈ 0.04768
This means that to survive a 21-loss streak, the starting wager must be less than 5 paisa — which is not practical in real trading.
On the other hand, with a realistic base wager, the capital can support only about 7 consecutive doublings which is far below the required 21, creating a fundamental mismatch.
Key Implications:
- If the base wager is realistic → the strategy fails early due to insufficient capital
- If the base wager is small enough to survive → the returns become negligible
The Asymmetry of Winning vs. Losing Streaks
We also generated a synthetic win streak using the win probability paths for comparison.
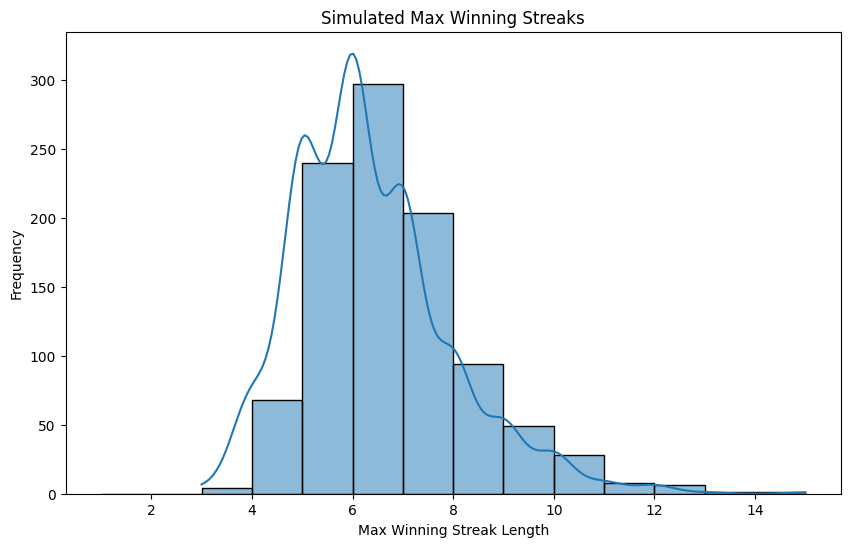 Figure 6: Simulated Max Winning Streaks — distribution of maximum winning streak lengths across 1,000 paths
| Metric | Losing Streaks (Real NEPSE) | Winning Streaks (Simulated) |
|---|---|---|
| Maximum observed | 21 days | ~14 days |
| 95th percentile | — | 9 days |
Our simulation shows that 95% of the time, the longest winning streak you can expect is only 9 days. Compare this to the real-world NEPSE losing streak of 21 days. This massive gap proves that the market's bad days are much longer and more frequent than its good days, making recovery statistically impossible. What we now do is simulate the strategy in randomized signal outcome.
The calculated Probability of Ruin is 74.5%. This means that in nearly 3 out of 4 scenarios, a trader using this strategy will hit their maximum bet limit or lose their capital before they can recover. It isn't a 50/50 gamble. The odds are heavily stacked against the trader.
Even using randomized outcomes, only very few people made profit.
Deeper Martingale Stress Test
Fee vs. No Fee Comparison
This section compares Martingale equity curves with and without fees. The final balance here describes the balance before the ruin. Although we can see small margins when the fee is applied, it really didn't affect the outcome.
| Scenario | Final Balance | PnL | ROI % | Max Drawdown % | Ruin |
|---|---|---|---|---|---|
| No Fee | NPR 108,000.00 | 8,000.00 | 8.00 | 6.09 | True |
| Fee (0.40%) | NPR 107,872.00 | 7,872.00 | 7.87 | 6.12 | True |
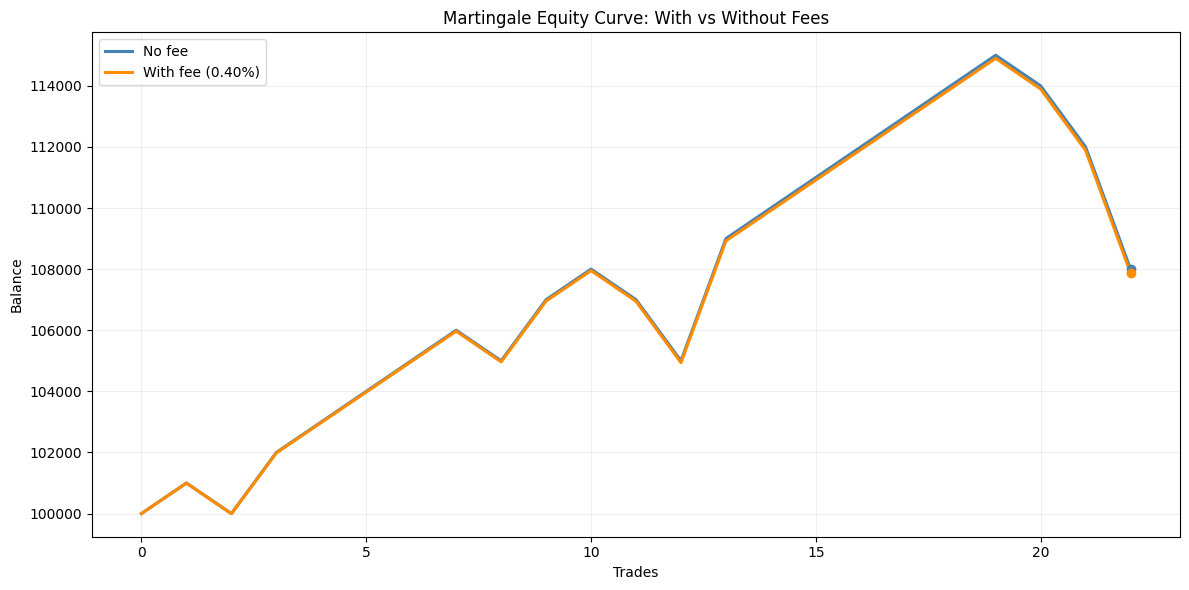 Figure 7: Outcome with and without the Fee — equity curves overlaid side by side
Monte Carlo Simulation: 1,000 Paths
The distribution chart above shows the results of 1,000 simulated trading paths, comparing how the strategy performs with and without a 0.40 percent transaction fee.
The baseline shown in blue represents an ideal scenario where there are no transaction costs at all. The orange line reflects a more realistic case where fees are included.
As seen in the chart, the orange distribution overshadows the blue almost entirely at the lower balance levels. This high frequency (density) of outcomes below our initial investment shows that fees significantly accelerate the path to failure.
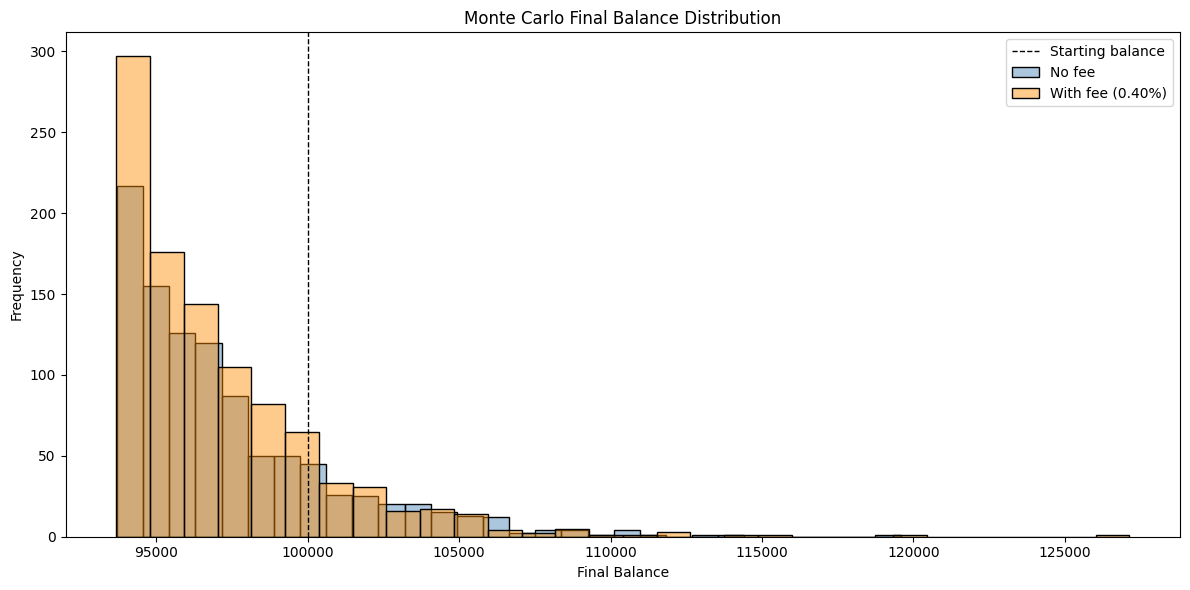 Figure 8: Monte Carlo Final Balance Distribution — 1,000 simulated paths, with and without 0.40% fee
| Scenario | Mean Final Balance | Median Final Balance | Ruin Probability |
|---|---|---|---|
| No Fee | NPR 97,313.20 | NPR 96,300.00 | 100.00% |
| With Fee (0.40%) | NPR 97,057.42 | NPR 96,112.00 | 100.00% |
The most important takeaway here is the 100 percent ruin probability in both scenarios. Given enough time, the NPR 5,000 bet limit makes it inevitable that every participant will eventually face a losing streak they cannot recover from.
Even though ruin is certain in both cases, the 0.40 percent transaction fee makes things worse. It acts like a steady drain on the account. The average and median balances are consistently lower when fees are included, which means the traders are dealing with market volatility and also with continuously losing capital to costs.
To conclude, this data reveals the reality of the Martingale system. Even though the account balance might still be positive for some time, the strategy is not a path to profit and is a mathematical guarantee of loss. Once the losing streak exceeds our doubling power, recovery becomes impossible.
Does Reducing Your Bet Size Help?
This analysis looks at how changing the starting wager affects how long the strategy can survive in the NEPSE index. Martingale is often presented as a way to manage risk by starting with smaller bets, but in reality, it behaves more like a random walk with a clear limit — either your available capital or the NPR 5,000 maximum bet cap. Since the strategy does not have a positive expected return, the account balance is naturally pushed toward that limit over time.
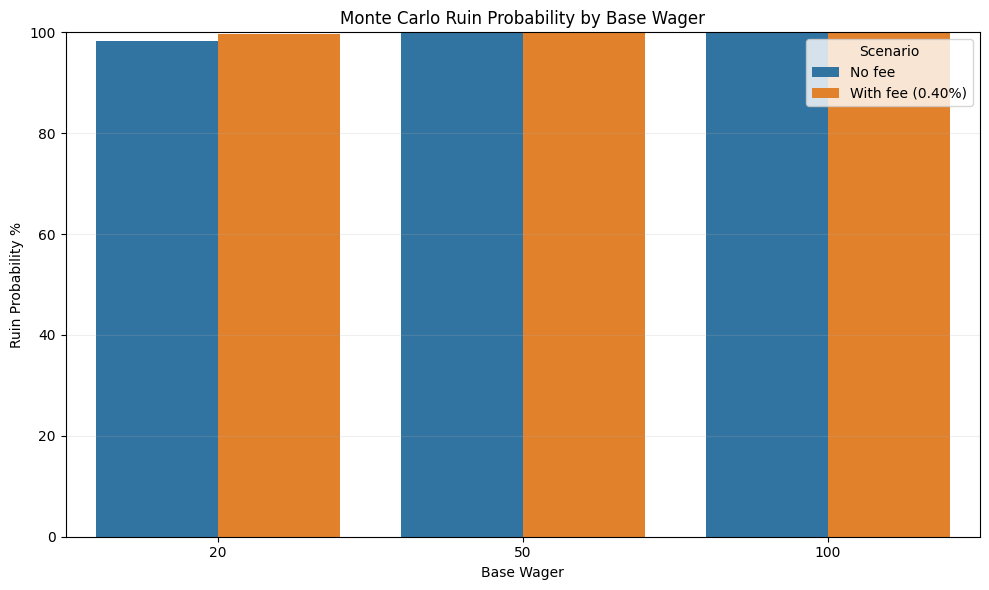 Figure 9: Monte Carlo Ruin Probability by Base Wager (NPR 20, 50, 100) — No Fee vs With Fee (0.40%)
| Base Wager | Scenario | Mean Final Balance | Median Final Balance | Ruin Probability |
|---|---|---|---|---|
| NPR 20 | No Fee | NPR 97,366.13 | NPR 96,630.00 | 98.33% |
| NPR 20 | With Fee | NPR 97,042.56 | NPR 96,316.28 | 99.67% |
| NPR 50 | No Fee | NPR 97,122.50 | NPR 96,025.00 | 100.00% |
| NPR 50 | With Fee | NPR 96,701.40 | NPR 95,839.80 | 100.00% |
| NPR 100 | No Fee | NPR 97,280.33 | NPR 96,300.00 | 100.00% |
| NPR 100 | With Fee | NPR 97,036.81 | NPR 96,082.00 | 100.00% |
The above data makes this pretty clear. The probability of ruin moves very close to 100 percent no matter whether the starting wager is 20, 50, or 100 NPR. Changing the starting amount only affects how fast you reach that point, not whether you reach it. Once transaction costs of 0.40 percent are included, the situation gets worse. For example, with a 20 NPR starting bet, the ruin probability increases from 98.33 percent to 99.67 percent.
What this shows is that reducing the starting wager does not fix the problem. It can only delay it. The strategy still breaks down eventually. On top of that, transaction fees act like constant friction, slowly eating into any gains. Even during winning streaks, the accumulated cost makes it difficult to stay ahead. In a real market environment, this makes the strategy unsustainable over time.
Conclusion
The Martingale strategy gives a sense of comfort. It feels like losses are only temporary, and that a win is bound to come if you just keep going. But markets do not follow that kind of logic.
What the data shows is much less reassuring. Even if the account stays positive for a while, the overall direction is already set. The strategy is not really building toward profit. Once the losing streak goes beyond what your capital can handle, there is no way to recover those losses.
The numbers make this clear:
- NEPSE win probability: 0.4520 — which is already slightly against you
- Maximum losing streak observed: 21 consecutive days
- Capital needed to survive that streak: requires a starting bet of less than 5 paisa
- Ruin probability from direct backtest: 74.5 percent
- Ruin probability from 1,000 Monte Carlo simulations: 100 percent
At that point, it stops being about decision making or market timing. The outcome is built into the structure of the strategy itself. Over a long enough period, the Martingale approach in NEPSE breaks down in a predictable way.
Disclaimer: This analysis is for educational and informational purposes only. It uses historical NEPSE data and mathematical simulations to evaluate a theoretical strategy; it does not constitute financial, investment, or gambling advice. Trading in the stock market involves significant risk, and the Martingale strategy is statistically proven to lead to total capital loss. Always consult with a certified financial advisor before making investment decisions.